Dashboard Module
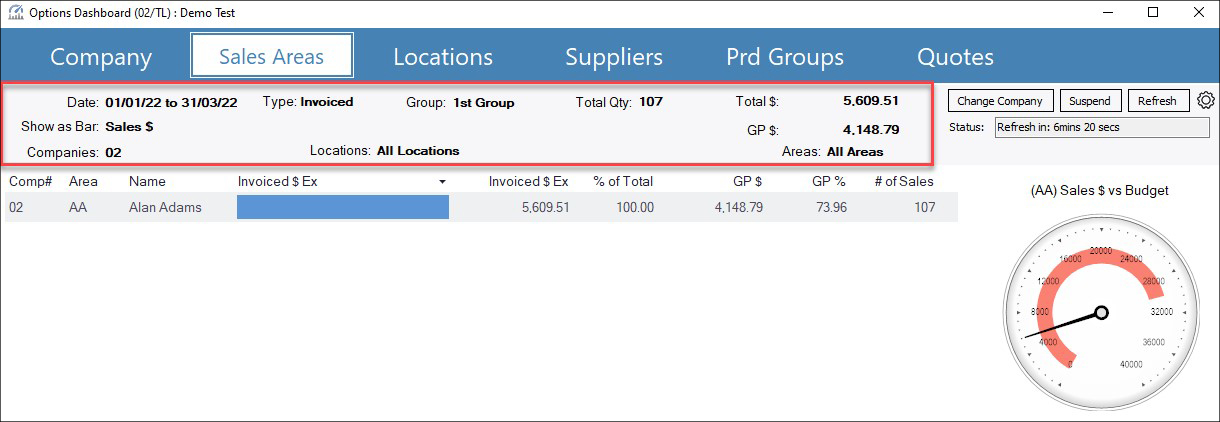
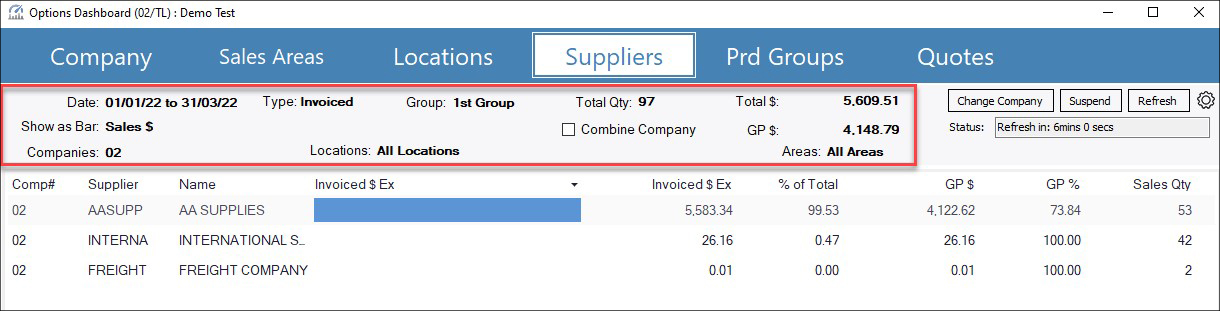
The Sales Dashboard offers a quick and customizable view of sales performance, segmented by key categories such as Company, Sales Area, Locations, Suppliers, or Product Groups.Key Features:
- Customizable Tabs: Control which tabs to display, tailoring the dashboard to your specific needs.
- Access Management: Assign access permissions to different users, ensuring secure and relevant data visibility.
- Flexible Sales Metrics: Switch between written sales and invoiced sales in the settings for precise reporting.
- Dynamic Date Range: Select the desired sales period—current day, week, month, or year—to stay on top of your goals.
- This tool empowers users to gain targeted insights and make data-driven decisions with ease.
Reporting Dashboard
Provides quick sales analysis and KPI 's by company, sales person, location, product group, customer and supplier. Includes visual displays of bar or line graphs, comparison to budgets and best to worst options.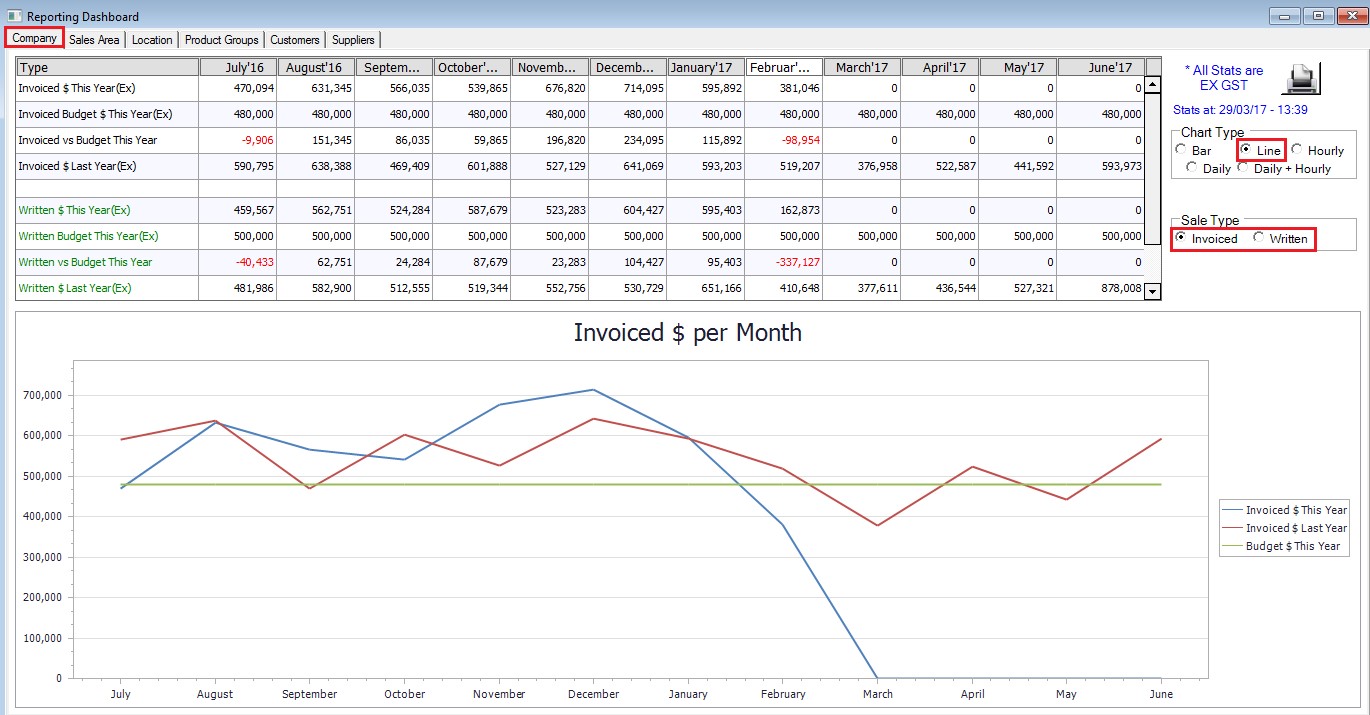
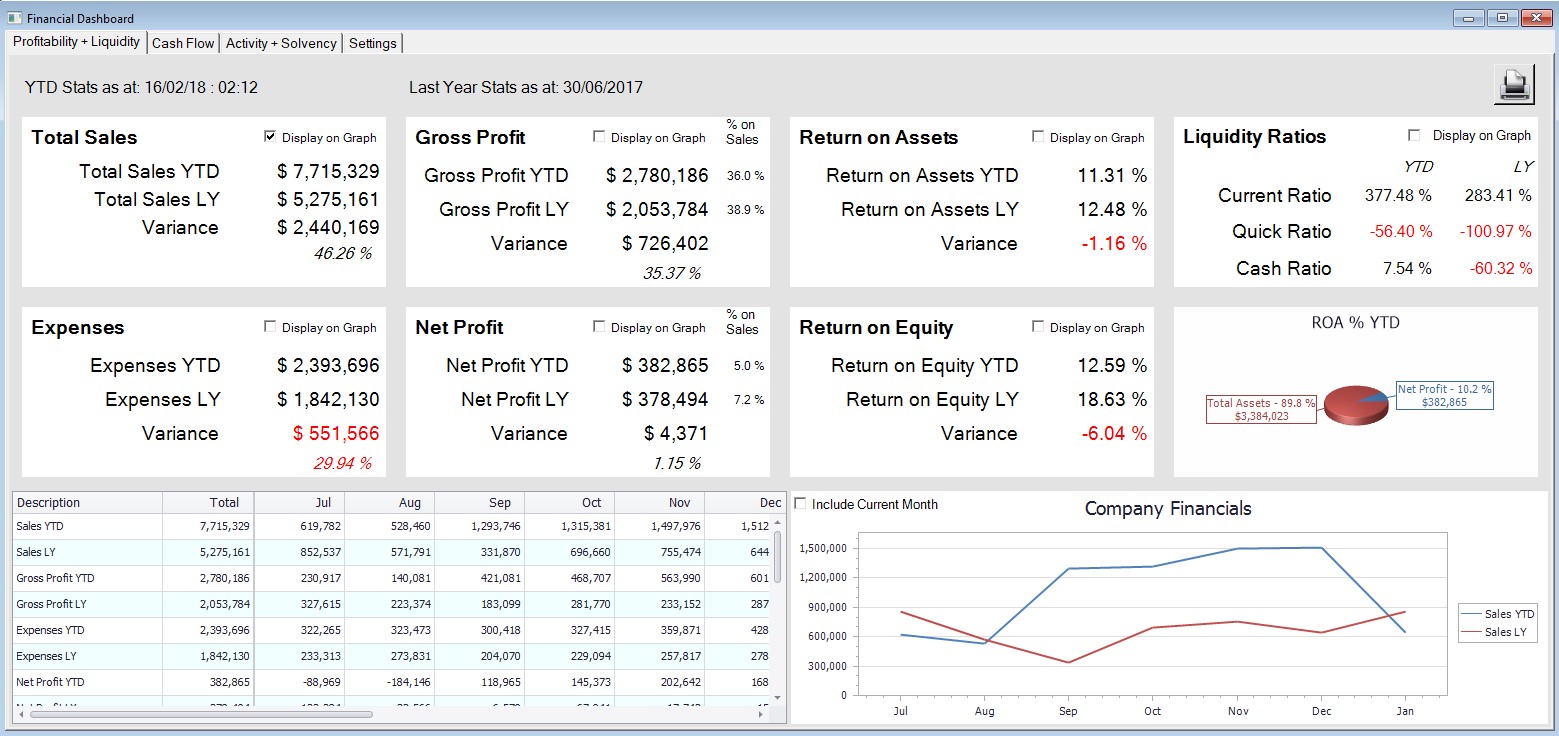
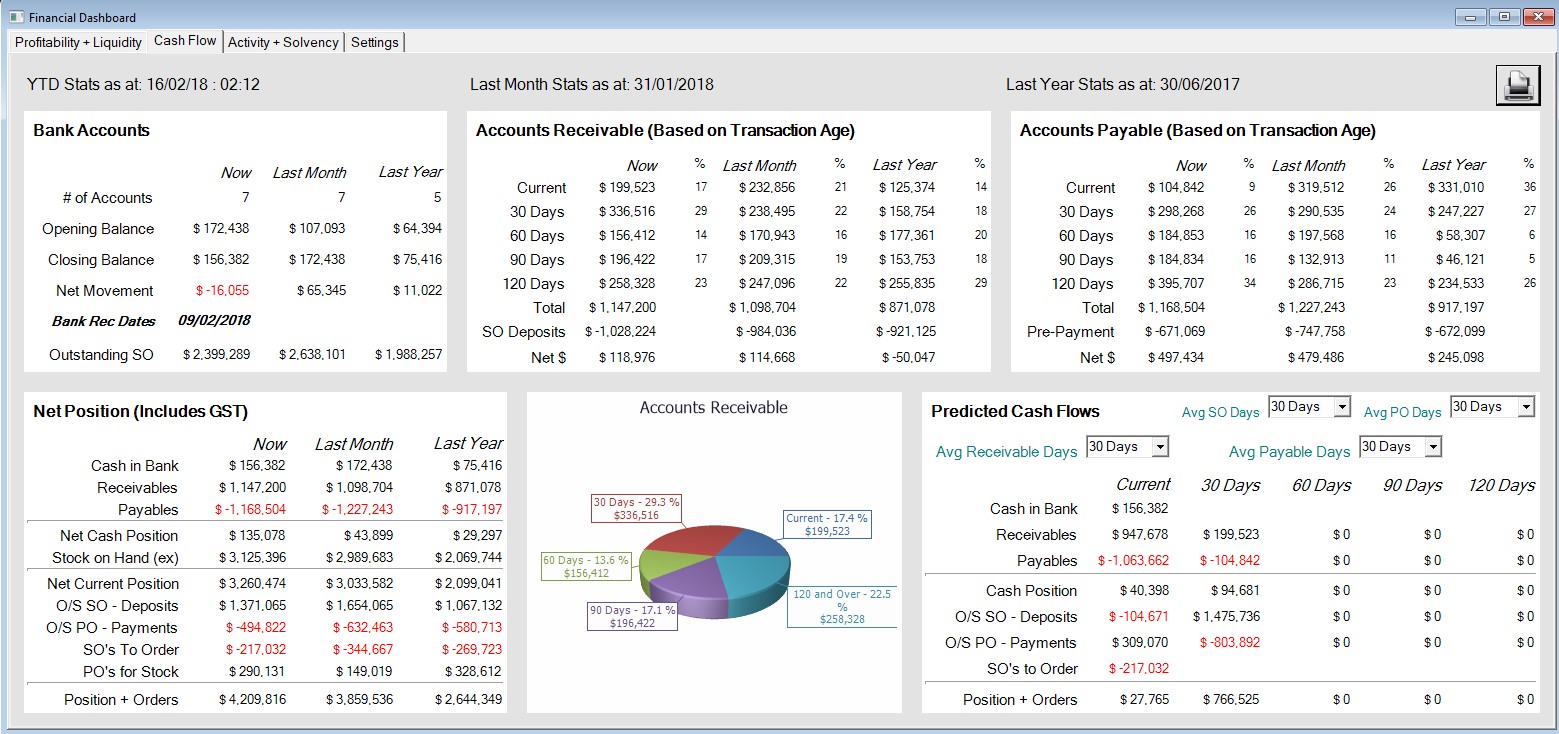
Financial Dashboard
The Financial Dashboard is aimed at giving business owners quick summary information about their business and a number of KPI’s. It has been designed to provide quick financial analysis as follows:-
Profitability + Liquidity TAB: figures are EX GST as GST is not owned by the company and therefore is excluded from these figures. Hover over line graph to give actual figures.
-
Cashflow TAB: Figures are INC GST as they include Accounts Receivable and Payable which are INC GST.
-
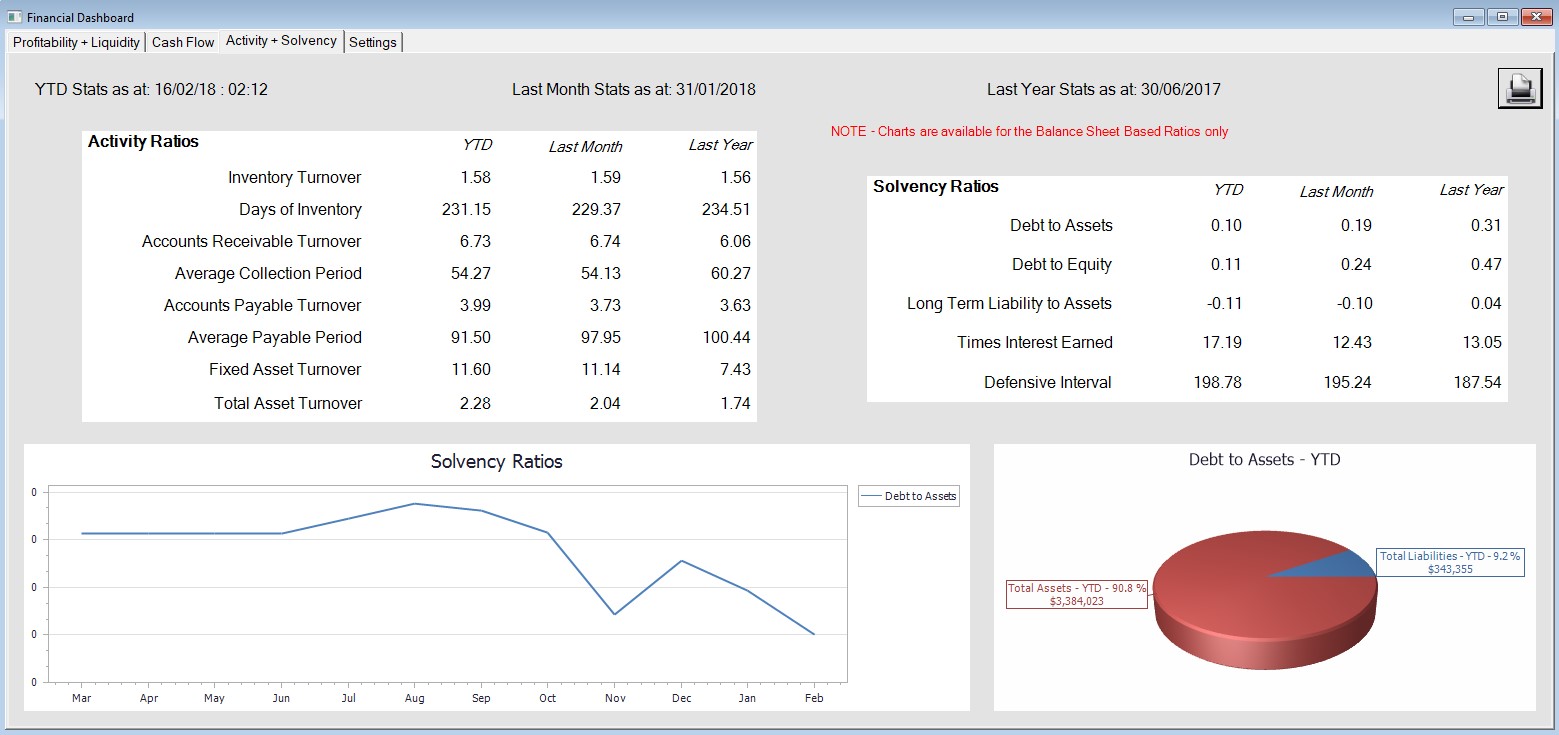
Activity + Solvency TAB: displays for YTD, Last Month, Last Year the Activity Ratios and Solvency Ratios.
Warehousing

Have you seen our
e-commerce solution -
OPTIONS API? or
OPTIONS MOBILE?
Contact us for more information or a Quote today!